
Winning campaigns involve turnout math.
Before a candidate decides where to knock doors, they need to answer a simpler question: How many people do I actually need to win my election?
Summary
At GoodParty.org, we calculate a win number based on a turnout modeling system that projects turnout across more than 130,000 elections per year using voter-level predictions generated using a national voter file covering more than 240 million voters. The voter file includes each voter’s historical participation across multiple election cycles and election types.
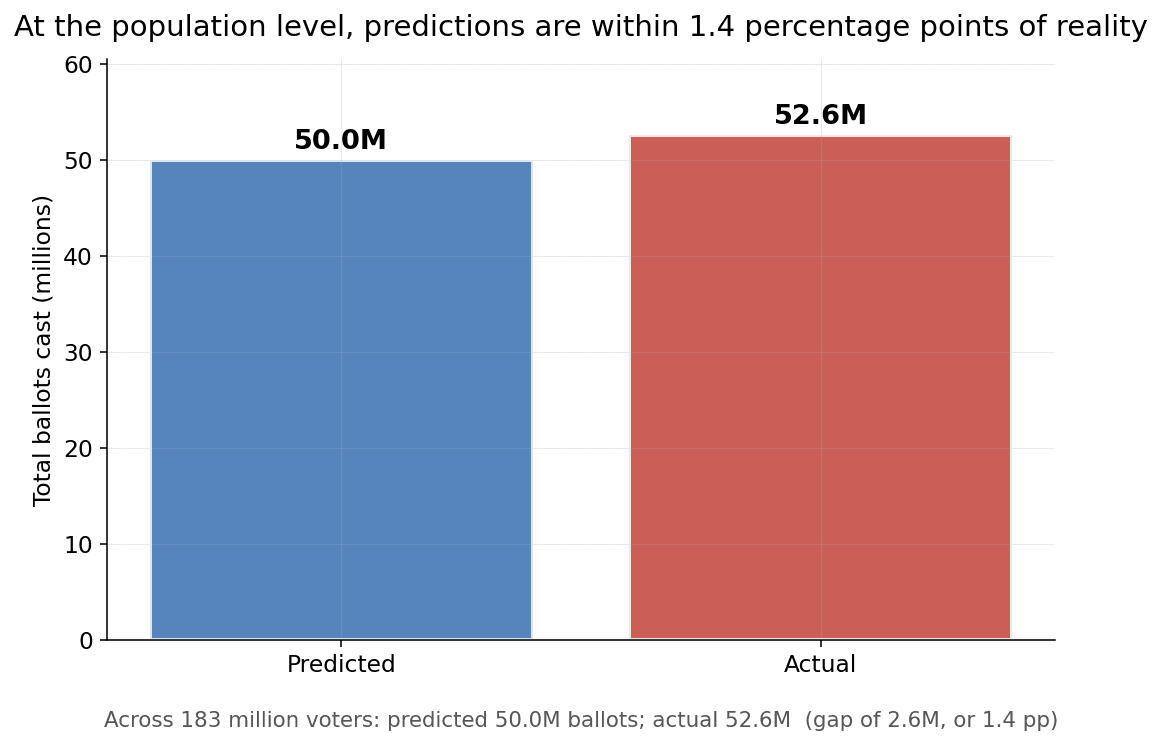
In 2025, our model predicted whether each of 183 million voters showed up to vote, within 1.5 percentage points! We then aggregate the number of voters in the candidate's district who are likely to vote and use that as the customized projected turnout number.
To make sure the candidate is prepared, even in an extremely high turnout election, the win number uses the highest end of the expected turnout range, so that we are very unlikely to project that the number of votes needed to win is lower than it will really end up being. To turn the total projected number of votes into a number of votes that a candidate will need to win, we pick the smallest number that would guarantee a victory if N votes were cast: N/2+1.
What our win number aims to do is extremely ambitious: to predict accurately predict voter turnout in every election that will be held across the country, far in advance. Some mistakes are inevitable. But this post explains why we are confident that our predictions provide candidates a safe number to aim for in planning their campaigns.
Training
The model assumes that the turnout in the upcoming election can be predicted using turnout from similar past elections. Past elections are classified into one of the following 4 types:
- November election day elections in Presidential election years
- November election day elections in off-years (even years where the president is not on the ballot)
- Municipal or local elections in even-numbered years
- Municipal or local elections in odd-numbered years
Target
For each registered voter in the L2 nationwide voter file, we stack past elections so that each voter's opportunities to vote (voter, past election pair) become one training row. The target is a binary variable (0 or 1) representing whether the voter voted in the given election.
Observations Selected
The training set includes only voters who were registered to vote at the time and who had a qualifying election in their precinct.
We assume that each voter has at least one opportunity to vote in an even-numbered year. In odd years, 28 states have at least one election day where there are municipal, school board, or state-level elections across the state (see Ballotpedia). In the other 22 states (+ DC), opportunity to vote is determined by evaluating whether any other voters in the voter's precinct voted in the given year.
Features
In building the model, we found that the strongest predictor of future turnout is prior turnout behavior in comparable elections. The model therefore learns participation patterns over time. In our latest version of the model, the predictors (“features”) considered are:
- Whether the voter voted in at least one election of each election type X years ago, for each X between 1 and 12
- Whether the voter had an opportunity to vote in the given election
- The voter’s age at the time of the prior election
- The voter’s time since registration at the time of the prior election
Final Training Set
Depending on the election type, individual models were trained on more than 760 million voter-election observations with roughly 90 engineered features.
Training set sizes for example models trained:
| Model | Total features |
|---|---|
| midterm_lag2 | 51 columns (99 dummies) |
| off_year_local_lag3 | 44 columns (91 dummies) |
Model
Output: The model’s output is a number between 0.0000 and 0.9999 representing the model’s prediction of the voter’s likelihood to vote.
The trained model has specific weights for each of the 4 election types.
Our current model is a MultilayerPerceptronClassifier — a small feed-forward neural network. We used a neural network to capture complex non-linear interactions between the features.
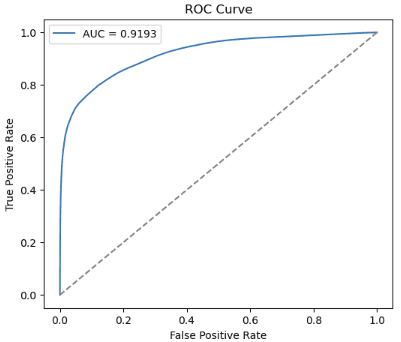
Using 3-fold cross-validation on a 1–5% subsample, we picked the most efficient configurations using mean AUC.
Example model sizes:
| Model / version | Layers | Hidden neurons |
|---|---|---|
| voter_turnout_model_even_year_local_lag2 | [95, 8, 4, 2] | 8, 4 |
| voter_turnout_model_midterm_lag2 | [99, 10, 5, 2] | 10, 5 |
| voter_turnout_model_off_year_local_lag3 | [91, 8, 4, 2] | 8, 4 |
The models are intentionally small — typically around 1,000 trainable parameters — because historical turnout behavior itself contains strong predictive signal. Rather than relying on massive architectures, we focused on carefully engineered voter-history features and eligibility-aware training data.
Validation Metrics
The voter-level predictions are 20% held out for validation, using selection on the voter-level across cycles.
| Model | Best run AUC (areaUnderROC) |
|---|---|
| voter_turnout_model_midterm_lag2 | 0.8531 |
| voter_turnout_model_even_year_local_lag2 | 0.8460 |
| voter_turnout_model_off_year_local_lag3 | 0.8494 |
Metrics from one sample run – cross validation:
Inference
Projected Ballots
For future election years, each voter’s likelihood to vote is predicted from the model. The voter-level probabilities are then summed by district — so a district's expected turnout is the sum over voters of P(vote). This kind of summing is a property of expected values: in this example, the expected number of people who vote is the sum of the expected probability that each person votes.
Win Number
To obtain the win number, we start with an estimated number of ballots that is on the higher end of our projections, so that candidates aim for a number of votes that would win even in a very high turnout scenario. Then we divided that projected number of ballots by 2, and add 1, to obtain the smallest number that would guarantee a victory if the expected number of votes are cast. So the correct way to interpret our win number is not as the most likely number of votes needed to win, but, rather, as a safe target to aim for in a winning campaign.
Actual Performance
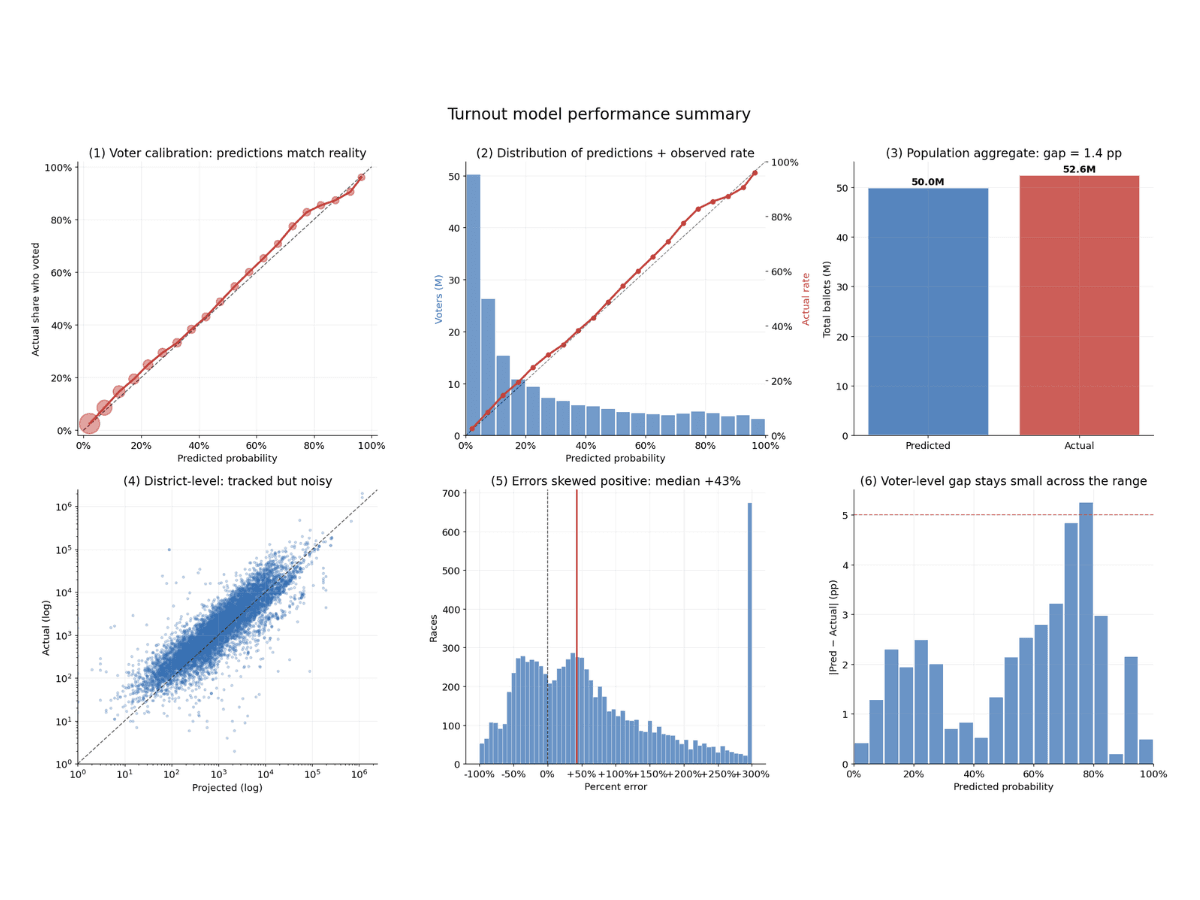
Over 2025, the model achieved an overall calibration error of 1.5pp, aligning predicted likelihoods with the actual turnout observed across 183 million voters.
| Metric | Value (2025) |
|---|---|
| Actual Voting Rate | 28.7% |
| mean(prob_vote) | 27.3% |
| Brier score | 0.122 |
| Mean absolute calibration | 0.0153 |
| Log-loss | 0.385 |
| Accuracy @ 0.5 | 82.9% |
| Precision | 76.2% |
| Recall | 58.9% |
| Specificity | 92.6% |
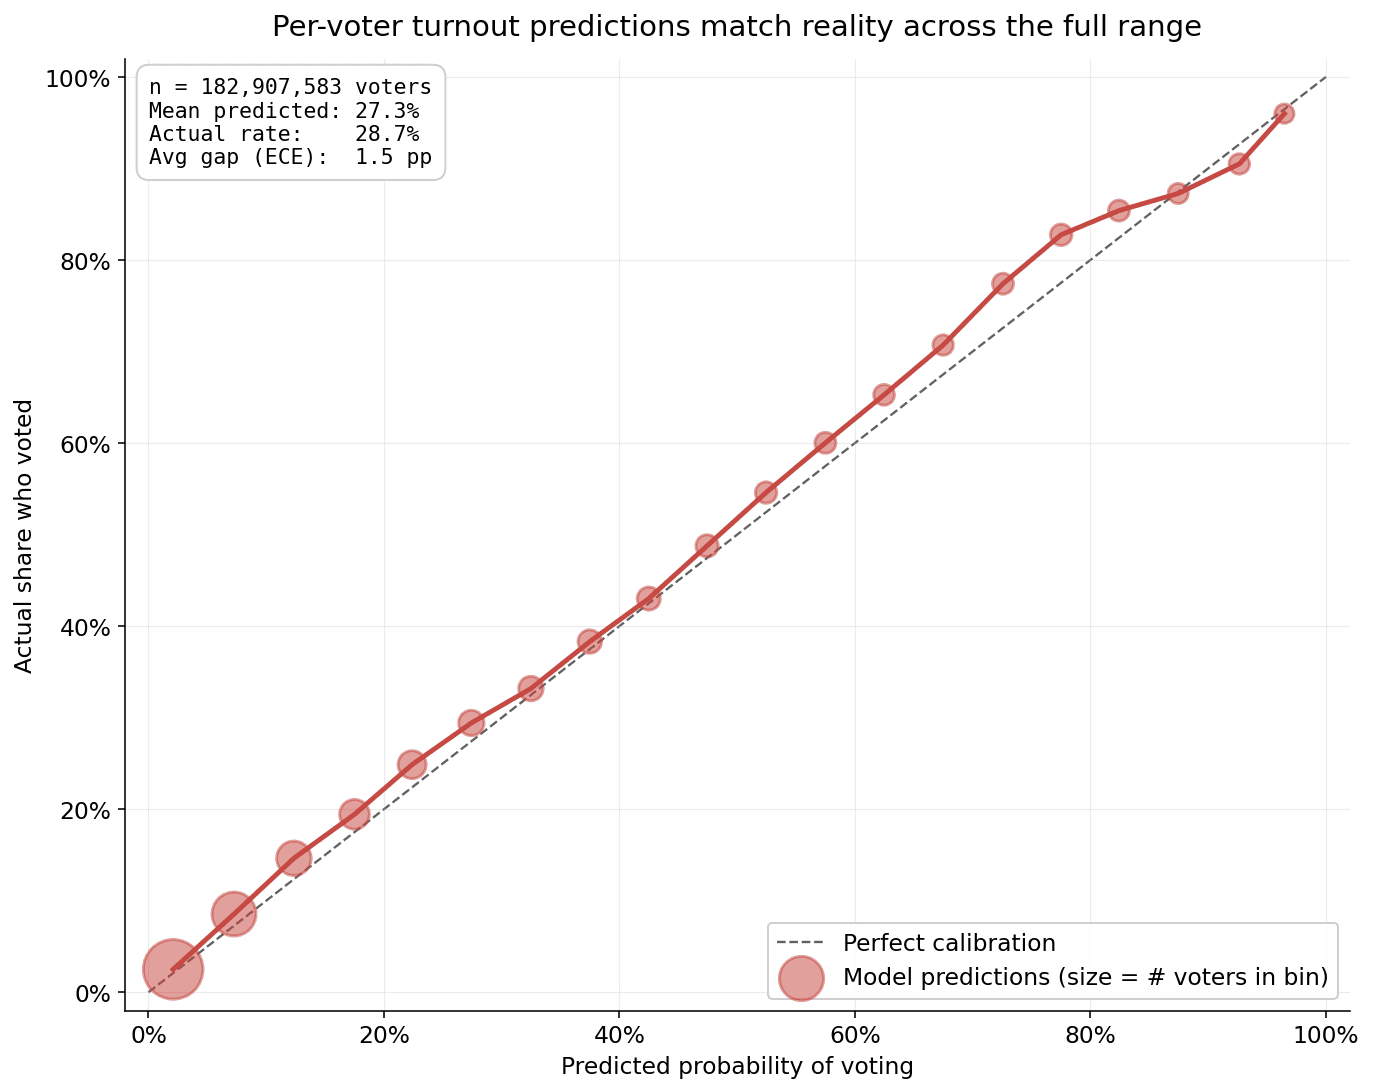
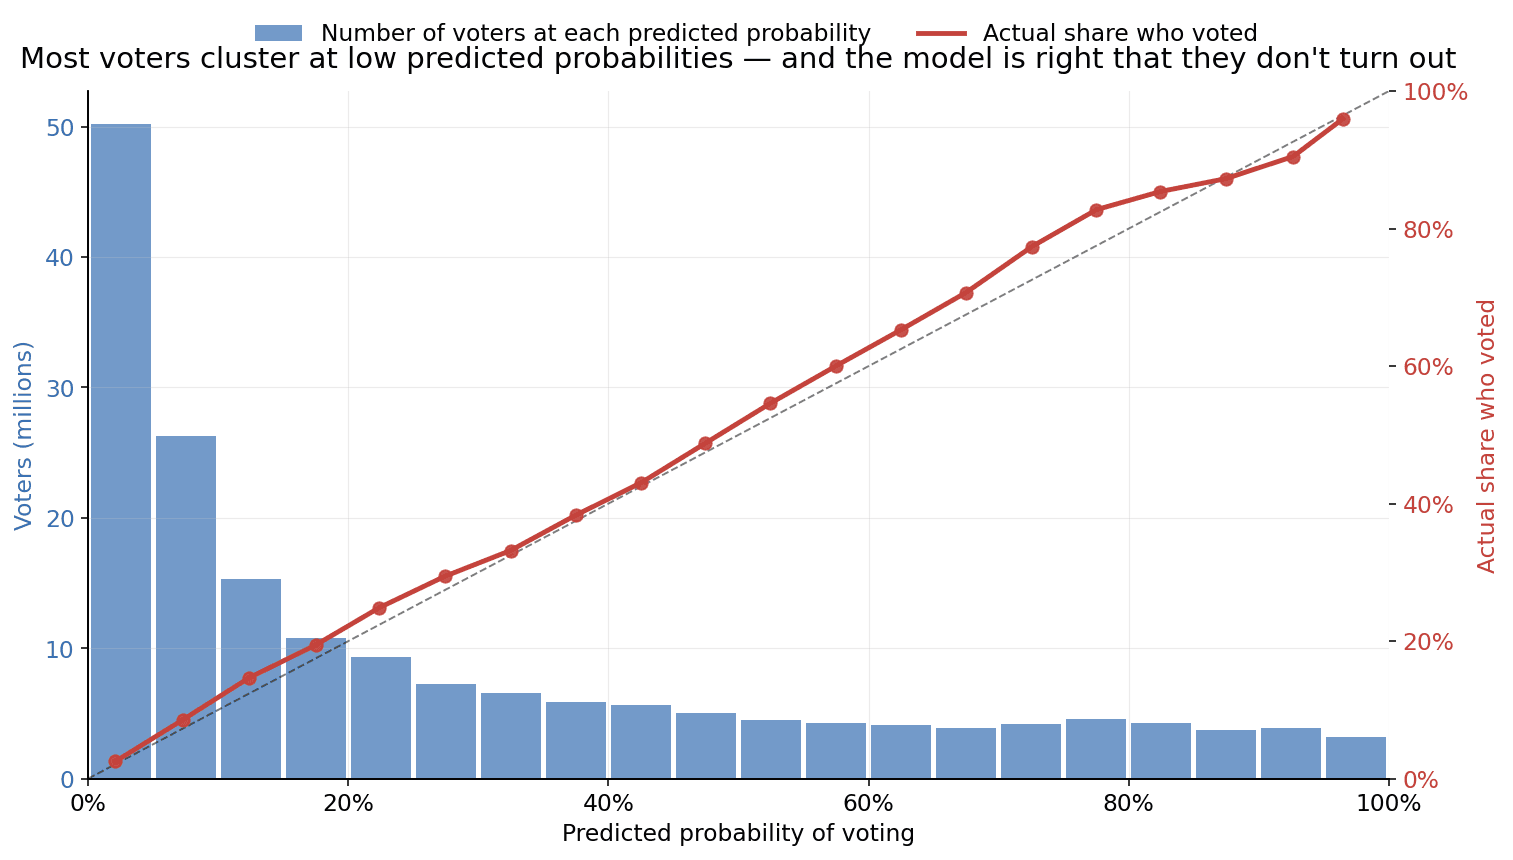
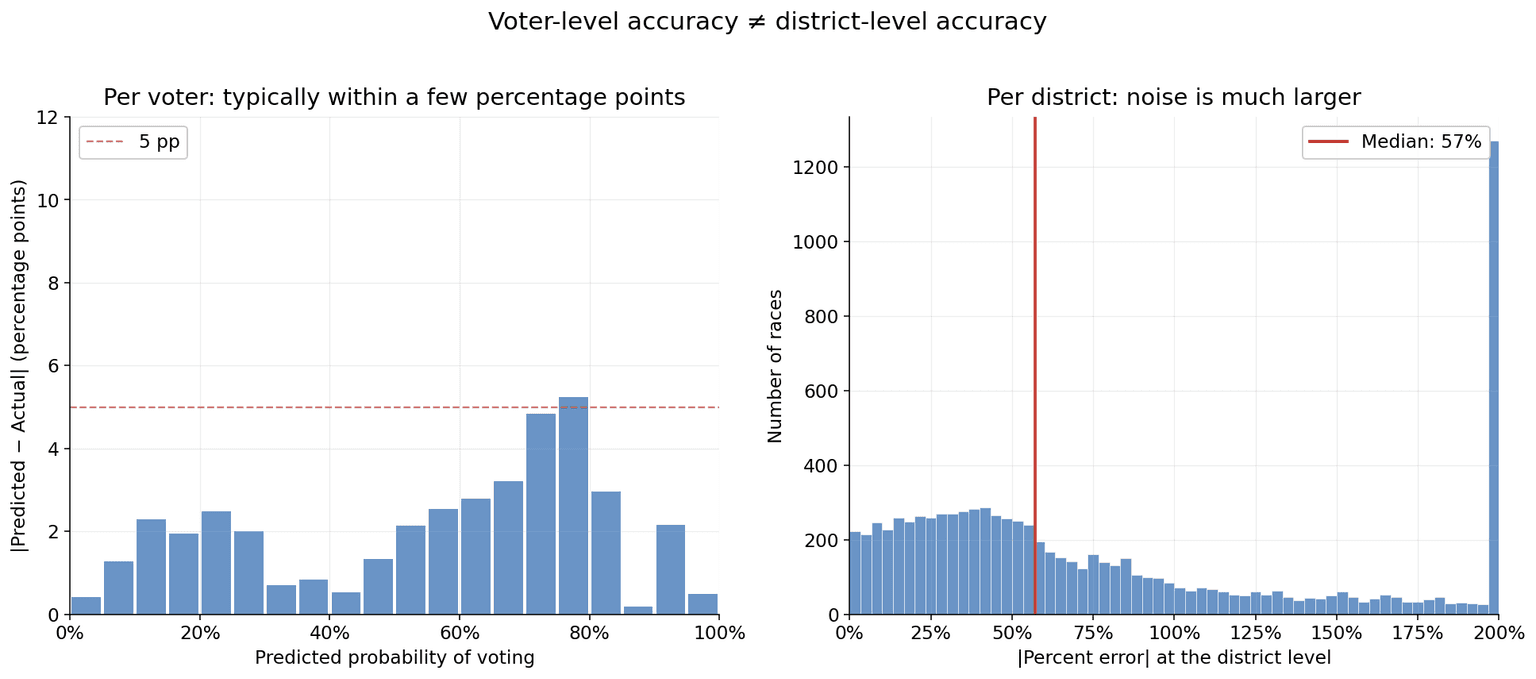
In the first chart above, each point in the chart groups voters with similar predicted turnout probabilities and compares those predictions against the actual turnout observed. The diagonal dashed line signifies perfect calibration—where projections perfectly match actual rates—and our model follows this path with high fidelity.
For example, among voters where the model predicted a 30% voting chance, roughly 33% of voters participated. At a 60% projection, the rate was approximately 65%, and at a 95% projection, it reached 96%. Across both low and high confidence tiers, outcomes remained consistently within a few percentage points of the forecast. Technically, the model shows a Mean Absolute Calibration of 0.0153. This metric quantifies the average variance between a predicted probability and the eventual outcome, representing a highly reliable result for turnout modeling.
Where It Gets Harder: Predicting Individual Races
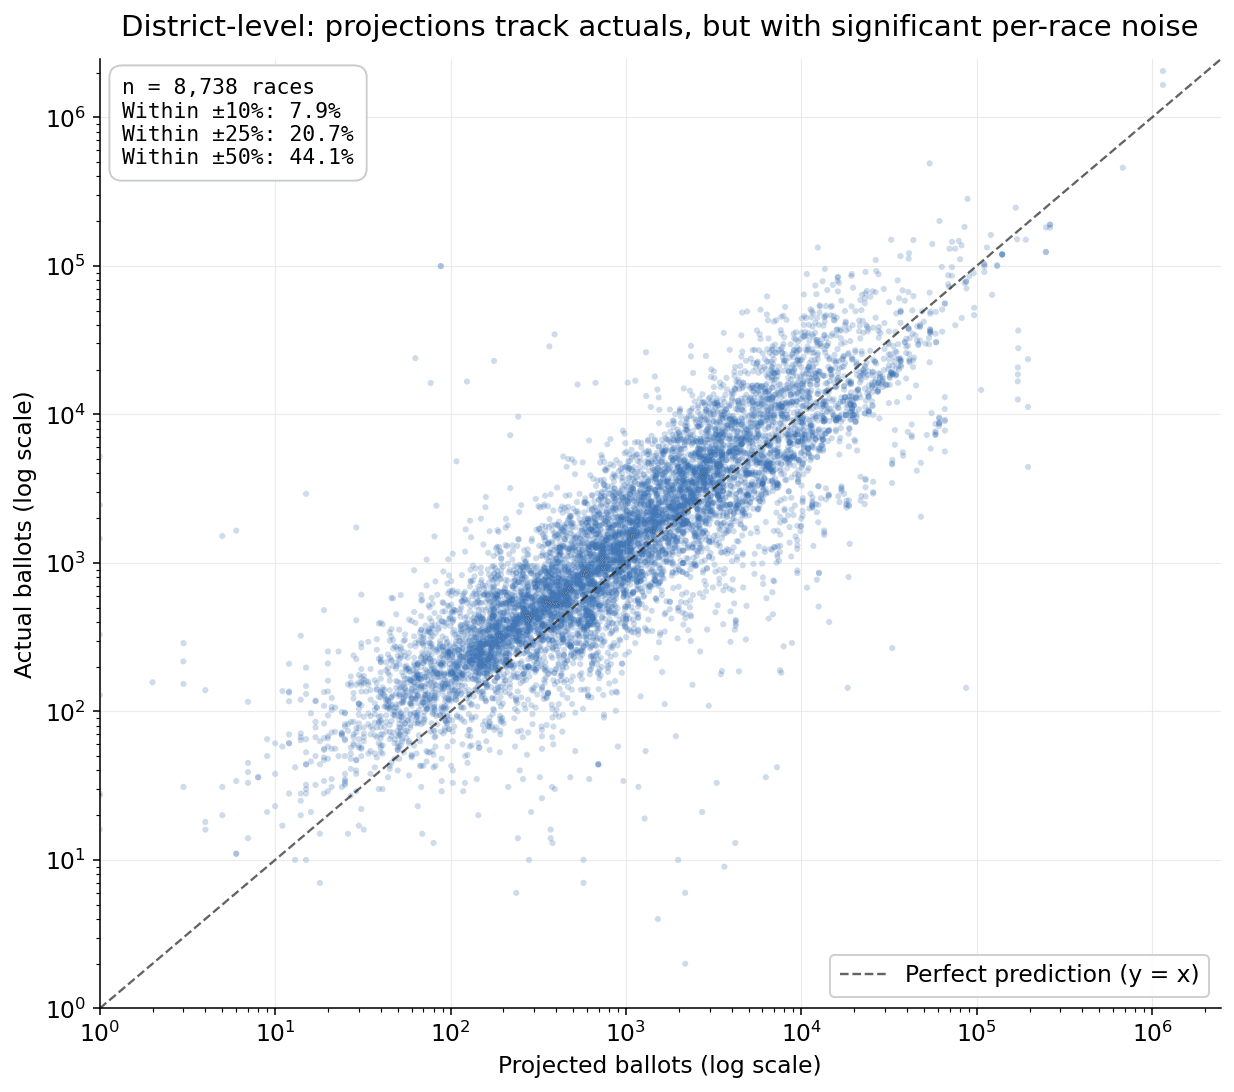
Predicting whether one voter will turn out is — somewhat counterintuitively — easier than predicting how many ballots will be cast in a single race. Districts have correlated noise that no per-voter model can see: a contested local issue, candidate quality, weather, late-breaking news. When you sum predictions across the few thousand voters in a single school-board race, those correlated shocks dominate.
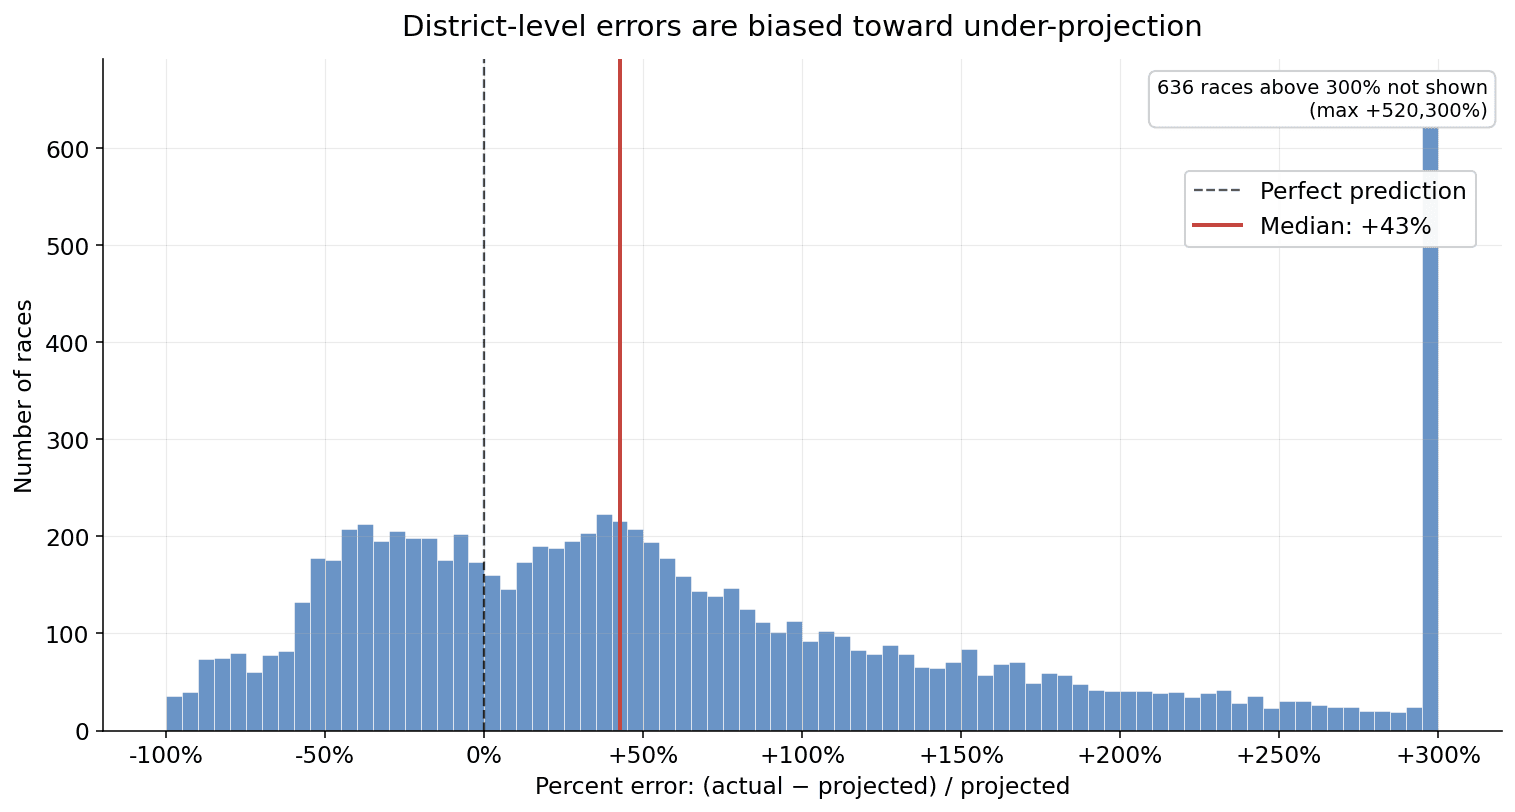
Across the 8,738 races in our 2025 holdout, the median race was off by about 43% of its projected ballot count. Most of that comes from genuine local variation, not model error.